
The Joint Was Running 40× Over the Speed Limit
We were validating a robotic arm simulation — pick, transfer, place. The KPI said "PASS." But watching the video, the arm was thrashing wildly, grabbing and dropping the object repeatedly. Numbers said pass; eyes said clear failure. Where was the disconnect?
The Blind Spot of Peak KPI
The cause was in the metric itself. At the time, "did the arm lift the object" was measured as maximum height (peak) — lift = peak height − start height. The problem: even if the arm drops the object mid-transfer, that peak value is still on the record.
Rendering diagram…
Peak says "if it was lifted even once, it passes." Drop the object 19 times mid-transfer, recover once, and that single peak height earns a PASS.
What Trajectory KPI Revealed
So we added trajectory KPIs — logging object position, grip duration, joint velocity, and wrist rotation at every timestep (10 Hz). The truth came out.
The worst-performing cell (multi-cube waypoint transfer) showed:
- Peak joint velocity: 12,078 deg/s — 40× the ISO recommended limit (~300)
- Accumulated wrist rotation: 697°
- Object drops during transfer: 19
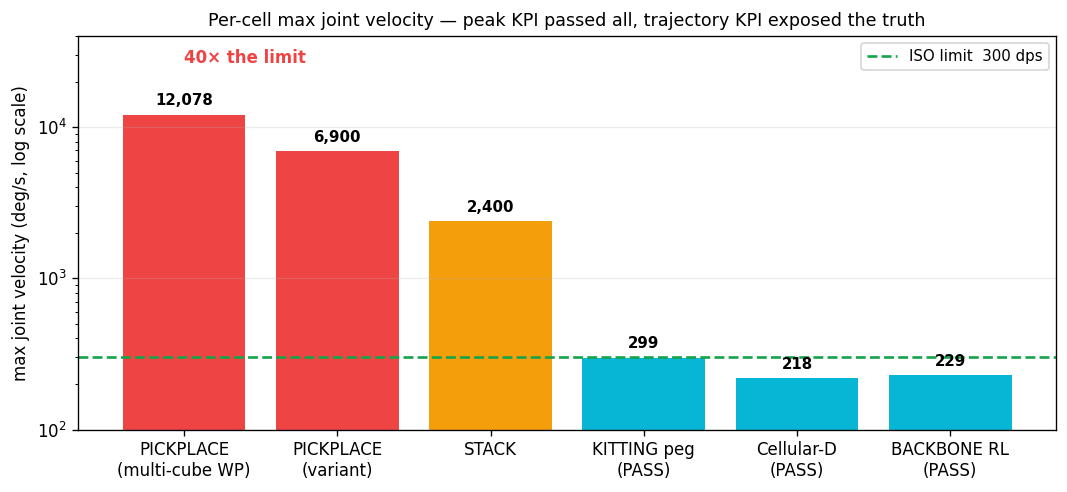 Per-cell peak joint velocity (log scale). Peak KPI passed everything, but PICKPLACE was actually running at 12,078 dps — 40× the limit (300, green line). Cells that genuinely passed (cyan) sit near the limit.
The chart makes it obvious — some of the cells that were logged as "PASS" tower above the limit, even on a log scale.
⚠️ Peak hides behavior — A metric that only looks at the maximum value can't see how that maximum was reached. Lifting an object smoothly and lifting it after dropping it 19 times are completely different behaviors, even if the final height is identical. You need trajectory to see the difference.
What a Genuine PASS Looks Like
The three cells that genuinely passed shared a clear profile.
- Single-cube, short motion — fewer waypoints, joint velocity near the limit (~299 dps).
- Reinforcement learning policy — a learned, smooth motion with the longest grip duration (8.57 seconds).
The failing cells all involved multi-cube waypoint transfers where the motion planner aggressively changed configurations, causing joint runaway.
💡 Don't trust "number PASS" — watch the behavior — The lesson here is that even when a KPI passes, you need to verify how it passed by looking at the trajectory. The user's intuition that "the video looks wrong" was correct; the peak numbers had been masking it.
In a nutshell
📌 A peak KPI measuring only "maximum lift height" awarded PASS even after 19 mid-transfer drops. Adding trajectory KPIs (per-timestep position, grip time, joint velocity) revealed that the supposedly-passing cells had joint velocities at 40× the limit (12,078 dps). Watch the behavior, not just the number.
References
See standard test results with videos and verdict evidence on the imSim Portal.
View public results →